Did crime in Hawaii really fall nearly 12% in 2025?
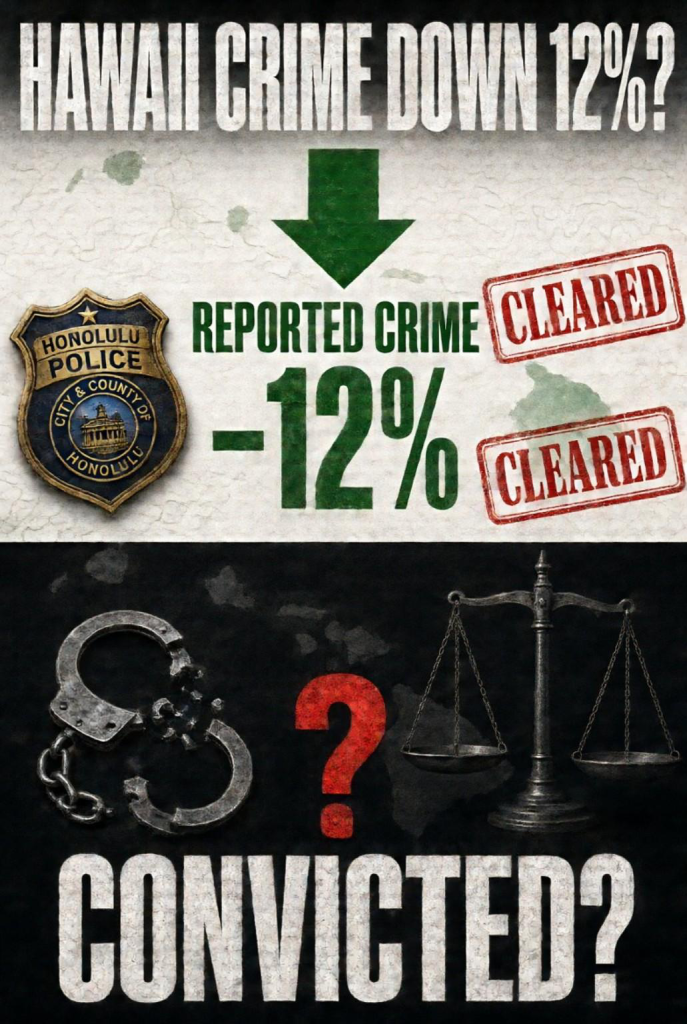
No. Reported crime fell nearly 12%. That is a very different thing.
The Hawaii Department of the Attorney General released numbers showing 54,089 Group A offenses statewide in 2025, a rate of 3,775 per 100,000 residents. That is an 11.6% drop from 2024. Property crime led the decline at 16.1%. Headlines followed. Police chiefs and mayors called it encouraging. The story spread on Facebook and local news as simple good news. It is not that simple.
What do the official numbers actually count?
Are these crimes that happened, or crimes people bothered to report?
They are crimes people reported to police (or that police discovered themselves). Nothing more.
Every major U.S. crime statistic starts the same way. Police log what is brought to them. If a resident decides the broken window or stolen tools are not worth the hassle of a report—because clearance rates are low, the deductible is high, or they simply do not expect results—that incident never enters the count. The official rate falls. Actual victimization may not.
What does “cleared” mean in these reports?
Does “cleared” mean someone was convicted?
No. It means police identified a suspect and (usually) made an arrest, or closed the case by exceptional means such as the suspect dying or the victim refusing to cooperate.
Statewide clearance hit 24.5% in 2025. That sounds better than it is. Property crime clearances stay far lower. Recent figures show burglary clearance around 7% on Oahu and about 17% on the Big Island. Motor vehicle theft on Oahu has hovered under 3% in recent years. Clearance ends at the arrest stage. It says nothing about whether prosecutors filed charges, whether the case survived, or whether anyone was convicted of the original offense.
How many people actually get convicted?
Can we see the full path from report to conviction?
Not easily. The public numbers stop well short of that.
Police track reports and clearances. Prosecutors track charging decisions. Courts track final dispositions. These systems do not publish a clean, linked dataset that lets anyone calculate “of the X burglaries reported, Y% produced a conviction for burglary or a related property crime.” Researchers who try to reconstruct it face mismatched case numbers, incomplete bulk data, and months of manual work. The result is that the most important accountability metric—how often the system actually holds someone responsible—remains opaque.
Older Hawaii studies and court caseload reports confirm the pattern: thousands of property crimes are reported each year, only a fraction are cleared by arrest, and a still smaller fraction end in conviction on the original charge. The gap is large and persistent.

Why the disconnect matters
When officials announce a double-digit drop in the crime rate, most people hear “we are safer.” What the number actually says is “fewer incidents were written up.” That can happen because crime truly fell. It can also happen because fewer people report, because policing priorities shifted, or because both occurred at once. Without transparent conviction data and independent victimization surveys, the public cannot tell which explanation is strongest.
Property crime is the category that moved the statewide number the most. It is also the category with the lowest clearance rates and the weakest public visibility into final outcomes. Celebrating the drop without acknowledging those limits turns a reporting metric into a political talking point.